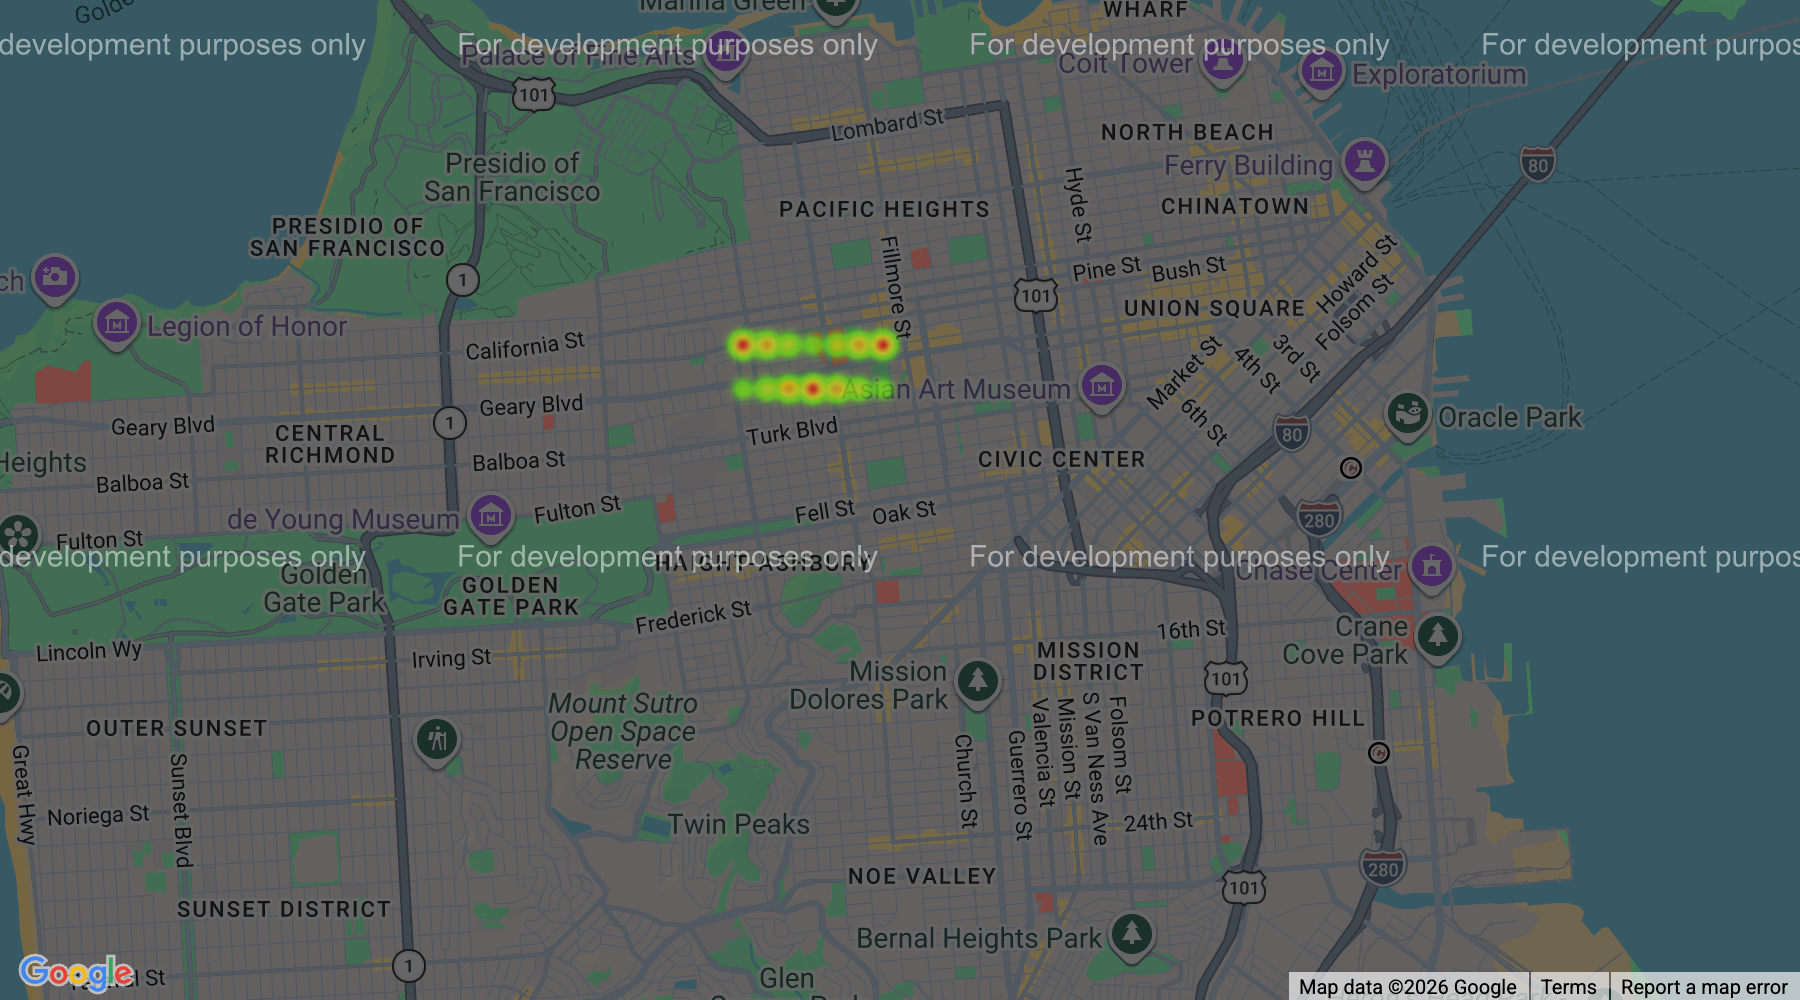
Heatmap Layer
NO LONGER AVAILABLE ON CURRENT API VERSIONS
The Heatmap Layer was removed from the Maps JavaScript API as of version 3.65. It is no longer available on the weekly (or any newer) channel, so this component only works if you pin the API to version 3.64 or earlier via the version prop on GoogleMap (or the v option of @googlemaps/js-api-loader).
This is a temporary workaround — Google rotates out old versions over time, so 3.64 will eventually stop resolving. The HeatmapLayer component was deprecated on May 27, 2025; Google recommends migrating to a third-party integration such as deck.gl, which offers a HeatmapLayer implementation. Learn more about the deprecation.
Use the HeatmapLayer component to depict the intensity of data at geographical points on the map. Make sure to include the visualization library in the libraries prop of the GoogleMap component, and to pin version to 3.64 (see the notice above).
Options
You can pass a HeatmapLayerOptions object to the options prop to configure your heatmap layer. Note that for convenience you can use LatLngLiterals if you wish for the locations.
<script setup>
import { GoogleMap, HeatmapLayer } from 'vue3-google-map'

const sanFrancisco = { lat: 37.774546, lng: -122.433523 }

const heatmapData = [
  { location: { lat: 37.782, lng: -122.447 }, weight: 0.5 },
  { lat: 37.782, lng: -122.445 },
  { location: { lat: 37.782, lng: -122.443 }, weight: 2 },
  { location: { lat: 37.782, lng: -122.441 }, weight: 3 },
  { location: { lat: 37.782, lng: -122.439 }, weight: 2 },
  { lat: 37.782, lng: -122.437 },
  { location: { lat: 37.782, lng: -122.435 }, weight: 0.5 },

  { location: { lat: 37.785, lng: -122.447 }, weight: 3 },
  { location: { lat: 37.785, lng: -122.445 }, weight: 2 },
  { lat: 37.785, lng: -122.443 },
  { location: { lat: 37.785, lng: -122.441 }, weight: 0.5 },
  { lat: 37.785, lng: -122.439 },
  { location: { lat: 37.785, lng: -122.437 }, weight: 2 },
  { location: { lat: 37.785, lng: -122.435 }, weight: 3 },
]
</script>

<template>
  <GoogleMap
    api-key="YOUR_GOOGLE_MAPS_API_KEY"
    version="3.64"
    :libraries="['visualization']"
    style="width: 100%; height: 500px"
    :center="sanFrancisco"
    :zoom="13"
  >
    <HeatmapLayer :options="{ data: heatmapData }" />
  </GoogleMap>
</template>
The above renders a heatmap like the following: